Claims Hub

Using claims stats to overcome objections
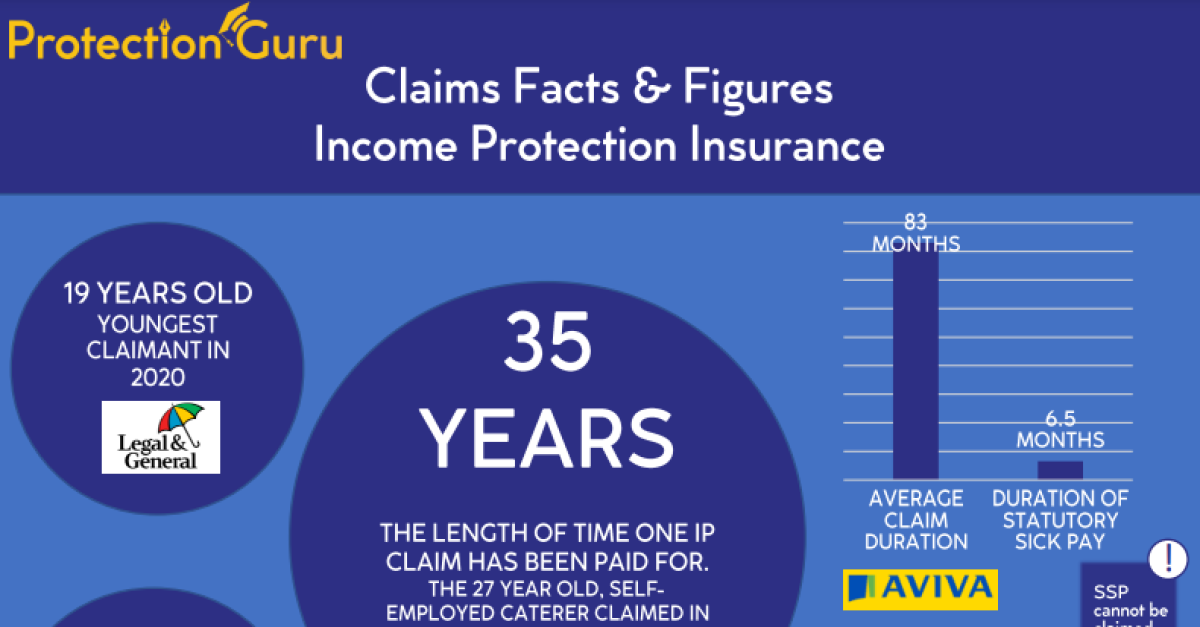
We have pulled together some of the most impressive claim stats from across the industry in order to provide advisers with a simple one page resource that can help overcome many client objections. These infographics will be updated regularly as insurers provide us with new and ever more impressive information, that could support advisers and back up the message that protection insurance is essential.
Claim Stories
there are few things more powerful for protection advisers than the real life stories of clients who have claimed on their protection policies. We bring together a collection of income protection and critical illness claim stories below:
Income Protection Claim Stories
Critical Illness Claim Stories
Life Insurance Claim Stories
Additional Services Claim Stories
Claim Processes
The point at which a person needs to make a claim on a protection policy is the point at which the insurer will really show their spots. If the process is simple, quick and as stress free as possible the whole industry shines. If there is unecessary friction in the process then the beneficiary of the policy can be left with a bad impression. See how different insurers approach the process of claiming on a plan in six different areas below:

Claims Handlers

Claims Notification

Claims Tracking

Claims Documentation
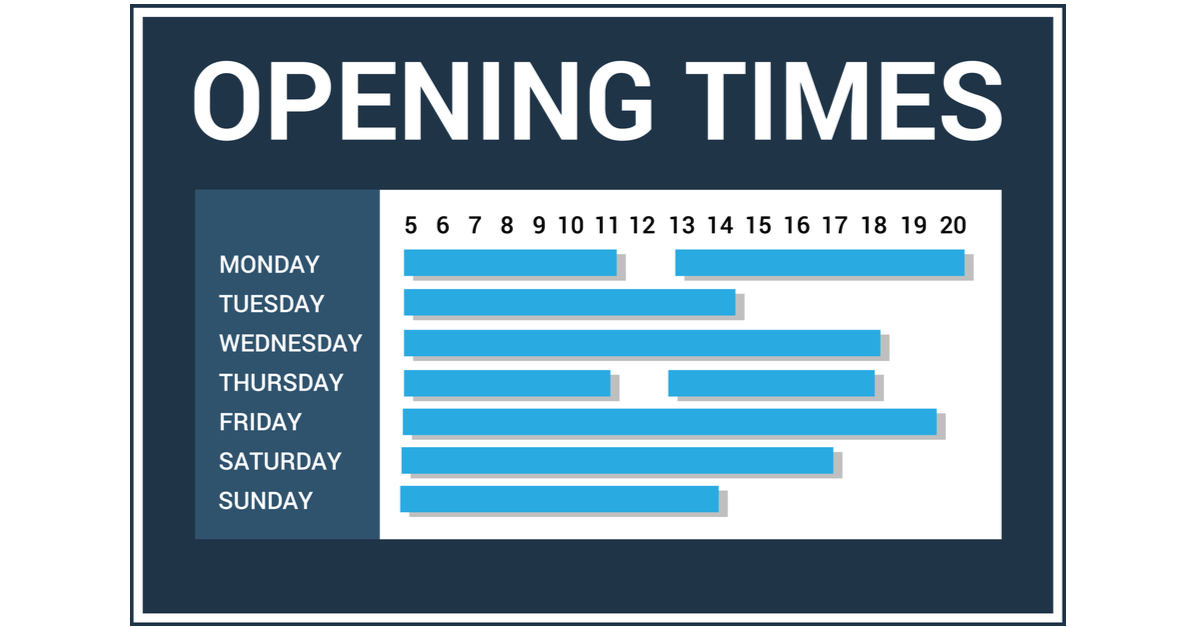
Call Centre Opening times


